From time to time, website owners report a sudden increase in spam activity and try to link it to plugin settings, hosting, or license status.
However, these assumptions often overlook how dynamic spam behavior truly is.
To illustrate this, I conducted a small study analyzing spam distribution over time using data from several of our WordPress sites.
First, I’ll look at data for three of our WordPress sites, which host our themed blogs. The statistics are for the year.
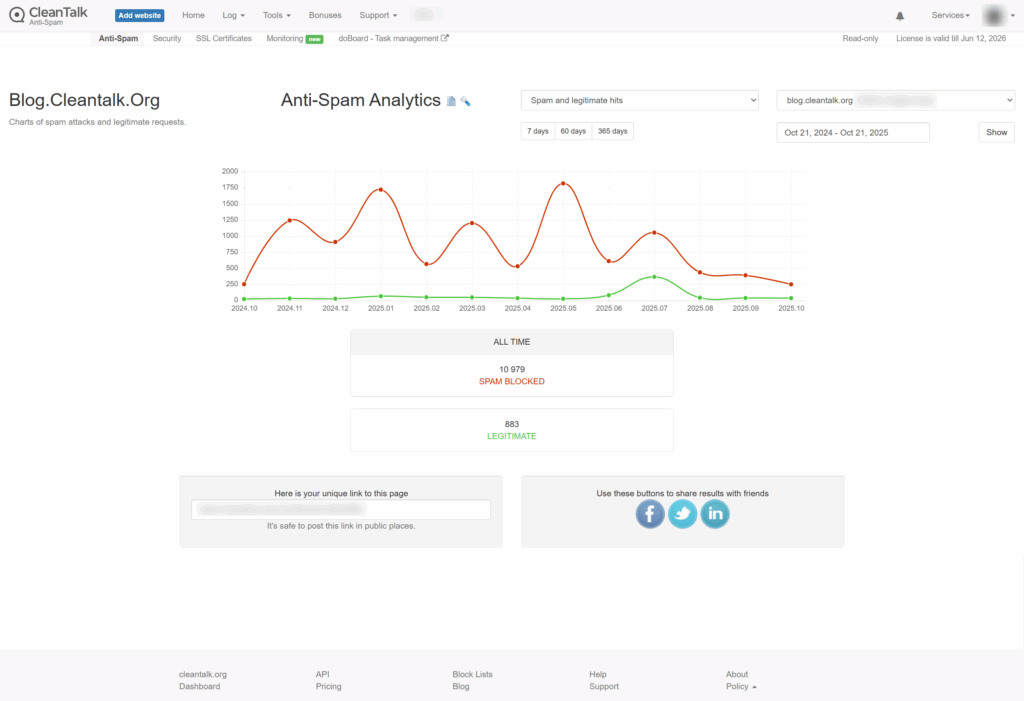
1. Our blog, ClanTalk Anti-Spam and Security https://blog.cleantalk.org/
The screenshot shows the statistics for the year.
As you can see from the graph, the number of spam attacks isn’t linear, but fluctuates from month to month. Only since August has there been any stability, and the number of spam attacks has been more or less consistent.
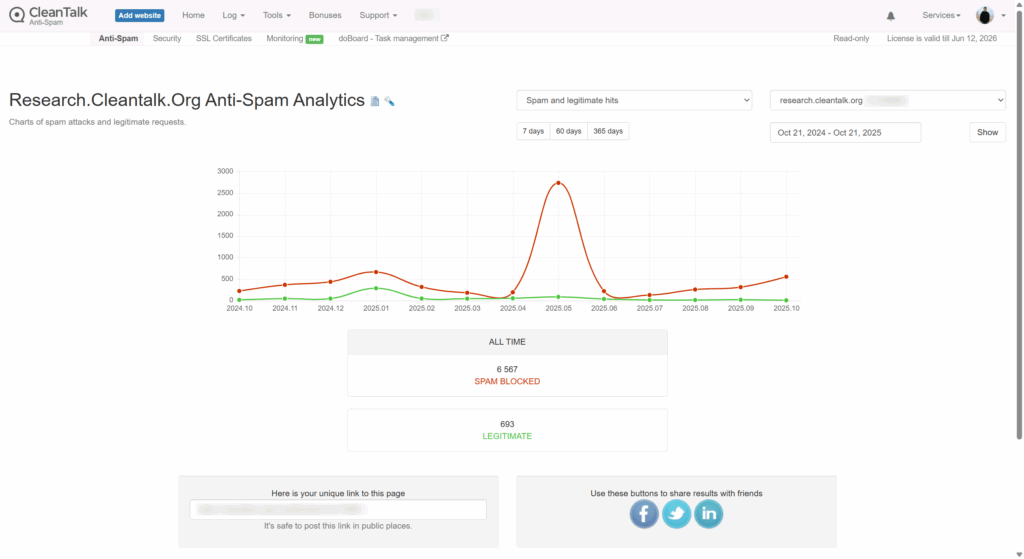
2. Our blog, research.cleantalk.org
The graph shows an increase in spam attacks at the beginning of the year, followed by a decline to almost zero. However, in May, there is a peak in spam attacks, followed by a sharp decline. Subsequently, there is a slight increase in spam attacks.
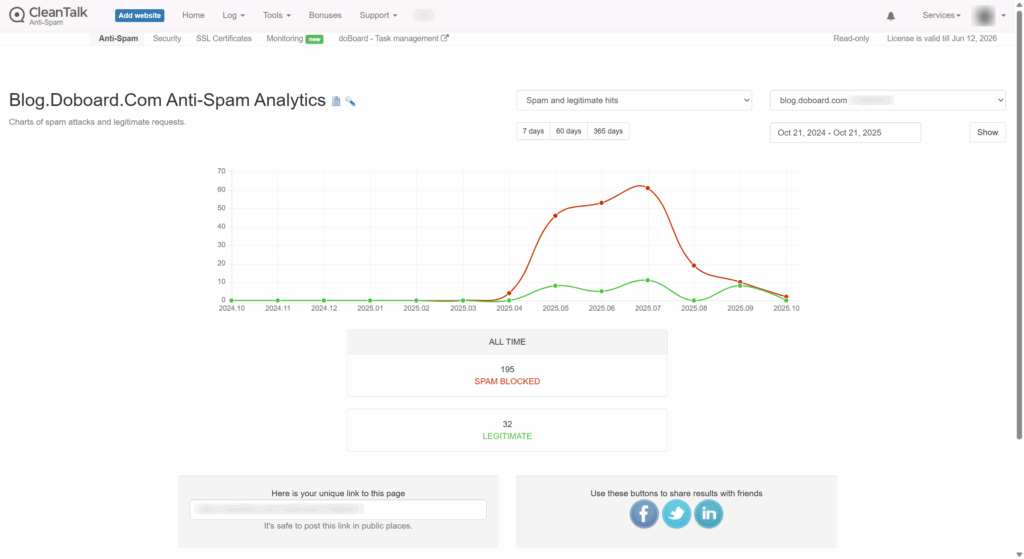
3. Our blog, blog.doboard.com
The blog was launched recently, and from the very beginning, it was clear that the number of spam attacks was high, but after some time, there was a decrease.
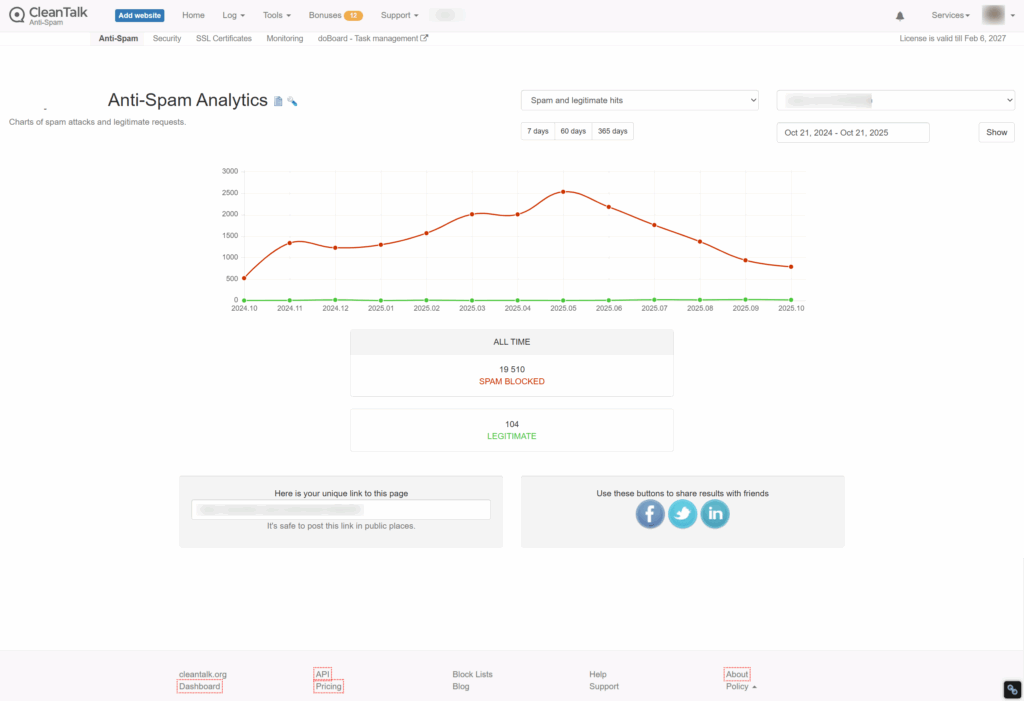
4. Personal WordPress Test Site
The following graph shows statistics for my personal WordPress site, which I use for testing.
The graph shows a steady increase, peaking in May and then declining.
What Does This Tell Us?
Based on this data, I can draw the following conclusions:
the number of spam attacks does not show any trend, other than a possible seasonal factor.
The number of spam attacks may not be linear from month to month or even from day to day. At some points, there may be more, at others, fewer. A low-traffic site like my test site can receive a much higher number of spam attacks than a site with more traffic, a larger number of articles, and a higher search engine ranking.
What I did next?
Now let’s talk about how a user can evaluate the difference between the amount of spam a client sees while using an anti-spam service and when the license expires.
First, as you can see on our new site, the number of spam attacks increases as it gets added to spam lists.
Second, when a client installs the CleanTalk Anti-Spam plugin, we have the SpamFireWall option. This option blocks spammers before they reach the site.
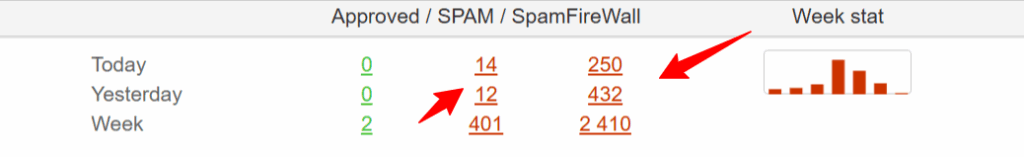
As you can see from this table, we currently receive 12-14 spam attacks per day. These requests can be found, for example, in the spam folder on their site. On average, there were 57 spam attacks per week, and SpamFireWall (SFW) blocked another 350.
Then, I disabled SFW, and the number of spam attacks reaching the website form immediately increased to 120 on average. So, we see that when using SFW, 50% of spam attacks reach the website and forms, and the remaining spam attacks were stopped by SFW and simply didn’t reach the website.
Therefore, when assessing the amount of spam, we must also take into account the portion of SFW traffic that simply didn’t reach the website forms. You can track statistics for your sites in the Trends section of the ClanTalk Dashboard.
To summarize
The number of spam attacks is not constant and can be higher or lower. Also, when using SFW, you only see a portion of the spam reaching the forms on your website. Having or not having a CleanTalk license doesn’t affect the number of spam attacks.
Leave a Reply