

TL;DR: Install counts tell you what is downloaded, not what is used. We looked at 36,207 WordPress admin page views collected over seven days across sites running our Security plugin, and counted which plugin screens administrators actually opened. The ranking looks nothing like the install charts: WP All Import, a plugin with 100,000 installs, accounts for 32.58% of all admin screen views, while Elementor, with 10 million installs, accounts for 0.78%.
Install counts do not measure usage
Every WordPress plugin page shows one number: active installations. It answers one question – how many sites have this plugin switched on.
It does not answer the question a site owner actually has. A plugin can sit in the plugins folder for three years without an administrator ever opening its screen. Another one is opened five times a day. Both count as one active installation.
There is no public dataset for the second question, because it requires watching what happens inside the WordPress admin. That is the data we have, and this is the first report built on it.
Methodology
Where the data comes from. Sites that run the Security & Malware scan by CleanTalk plugin. The plugin logs requests to the site, including admin pages, as part of its firewall function.
What we count. Requests to WordPress admin URLs that carry a plugin screen identifier – addresses of the form wp-admin/admin.php?page=…. Each such request is one admin page view, not one unique user and not one unique site. We say this plainly because it changes how the numbers should be read: a plugin whose screen refreshes itself during a long operation collects many views from a single administrator.
Period. A seven-day window in August 2026. 36,207 admin page views, 1,088 distinct screen identifiers, which map to 875 plugin families after normalisation.
How we identify a plugin. The page= parameter carries the plugin’s own screen slug. We normalise related screens into one plugin – wc-orders, wc-settings, wc-status and wc-admin all belong to WooCommerce – and match the result against the WordPress.org plugin directory to get the official name and install count.
Our own plugins are excluded. Every site in this sample runs a CleanTalk security plugin, so our own screens would always be near the top for reasons that have nothing to do with the market. We removed them from the dataset before calculating anything, and all shares below are counted on the remaining 36,207 views.
What this data does not show. It is not installs, not unique users and not market share. It is administrator attention: how often plugin screens get opened.
Limits of the sample, stated plainly. The sites are not a random sample of all WordPress – they all run a CleanTalk plugin. The window is seven days. The next report will count unique sites per plugin over a full calendar month, which is the more stable metric and the one we are moving to.
Top 10 WordPress plugins by admin page views
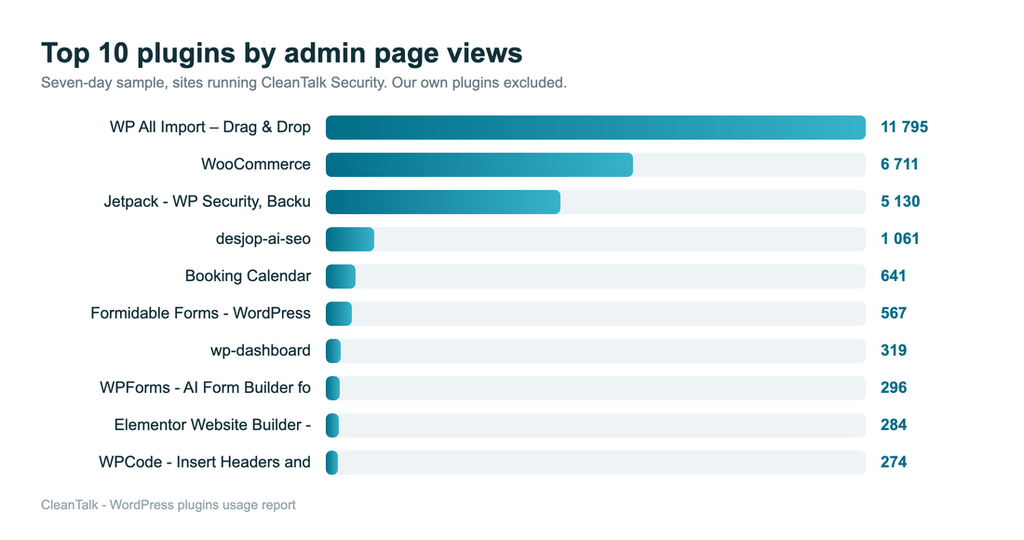
| # | Plugin | Category | Admin page views | Share | Active installs |
| 1 | WP All Import | Import and migration | 11,795 | 32.58% | 100,000 |
| 2 | WooCommerce | eCommerce | 6,711 | 18.54% | 7,000,000 |
| 3 | Jetpack | Security and tools | 5,130 | 14.17% | 3,000,000 |
| 4 | desjop-ai-seo | SEO | 1,061 | 2.93% | not listed |
| 5 | Booking Calendar | Booking and events | 641 | 1.77% | 40,000 |
| 6 | Formidable Forms | Contact forms | 567 | 1.57% | 300,000 |
| 7 | WPForms | Contact forms | 296 | 0.82% | 5,000,000 |
| 8 | Elementor | Page builders | 284 | 0.78% | 10,000,000 |
| 9 | WPCode | Administration | 274 | 0.76% | 3,000,000 |
| 10 | WP Super Cache | Performance and cache | 263 | 0.73% | 1,000,000 |
Read the last two columns together and the point of this report becomes visible. WP All Import has seventy times fewer installations than Elementor and generates forty times more admin page views. Its screens are where the work happens: you start an import, and you watch it run. Elementor’s work happens in the page editor, not in the admin menu.
Position 4 needs a note: desjop-ai-seo is not published on WordPress.org, so we cannot verify its install base. It appears to be a commercial AI SEO plugin used intensively on a small number of sites in our sample.
Why views and not unique users
The honest answer to the obvious question: this report counts views, and views are not visits. Different plugins have different working rhythms, and that alone shapes the table above.
- A contact form or a cache plugin is opened once, at setup, and then forgotten. It can protect a site for a year and never appear in a usage chart.
- A security plugin is opened irregularly – after an alert, during an incident, when something looks wrong.
- An eCommerce plugin is opened every day, because that is where the money is.
- An import tool produces the highest count of all, because its screen refreshes itself while a long job runs.
So this month’s ranking measures how much time a plugin holds an administrator’s attention. That is a real and useful signal, but it is not popularity. From the next issue we count unique sites per plugin, and the two numbers side by side will say much more than either alone.
Usage intensity: admin page views per 1,000 installs
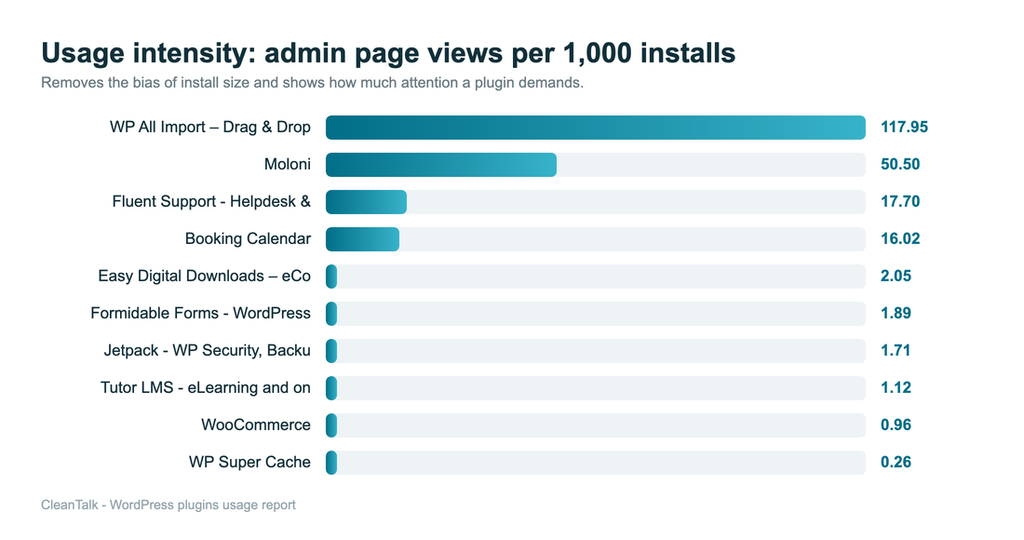
The ranking above rewards plugins that are simply installed everywhere. Dividing views by install count removes that bias and shows how much attention a plugin demands from the people who have it.
| Plugin | Views per 1,000 installs | Views | Installs |
| WP All Import | 117.95 | 11,795 | 100,000 |
| Moloni | 50.50 | 101 | 2,000 |
| Fluent Support | 17.70 | 177 | 10,000 |
| Booking Calendar | 16.02 | 641 | 40,000 |
| Easy Digital Downloads | 2.05 | 82 | 40,000 |
| Formidable Forms | 1.89 | 567 | 300,000 |
| Jetpack | 1.71 | 5,130 | 3,000,000 |
| WooCommerce | 0.96 | 6,711 | 7,000,000 |
| WP Super Cache | 0.26 | 263 | 1,000,000 |
| Wordfence | 0.05 | 233 | 5,000,000 |
| Elementor | 0.03 | 284 | 10,000,000 |
| Contact Form 7 | 0.02 | 216 | 10,000,000 |
| LiteSpeed Cache | 0.02 | 158 | 7,000,000 |
| Site Kit by Google | 0.02 | 89 | 5,000,000 |
Two clusters emerge, and they describe two kinds of software.
Work tools sit at the top: imports, invoicing, helpdesk, bookings. Someone opens them because a task has to be done today.
Infrastructure sits at the bottom: caching, contact forms, analytics connectors, a firewall. Contact Form 7 with ten million installs generates 0.02 views per thousand – the form works, the mail arrives, nobody opens the screen. That is not weakness, that is the definition of infrastructure. It is also a warning for anyone building plugins in these categories: your product is judged in the moments it fails, because those are the only moments users look at it.
Where admin attention goes, by category
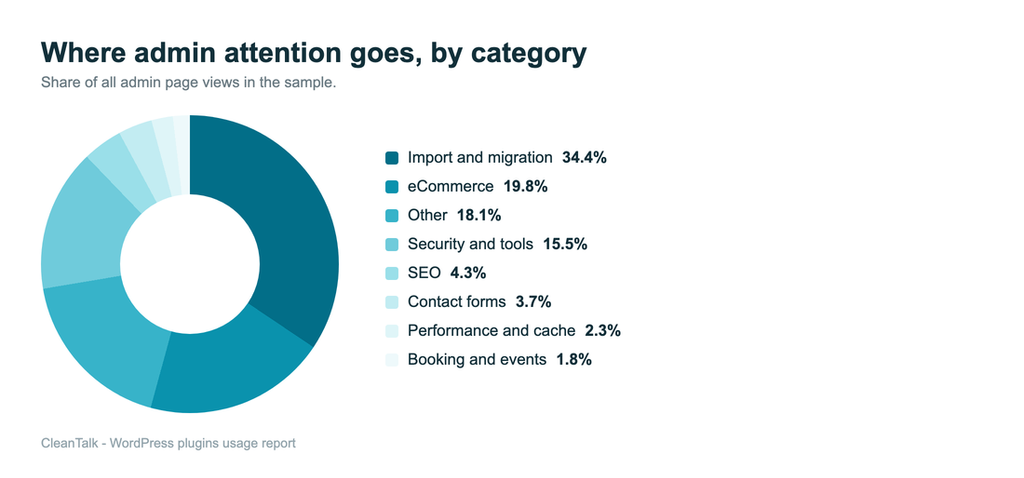
| Category | Admin page views | Share |
| Import and migration | 11,966 | 33.05% |
| eCommerce | 6,894 | 19.04% |
| Other | 6,292 | 17.38% |
| Security and tools | 5,380 | 14.86% |
| SEO | 1,502 | 4.15% |
| Contact forms | 1,283 | 3.54% |
| Performance and cache | 808 | 2.23% |
| Booking and events | 641 | 1.77% |
| Page builders | 495 | 1.37% |
| Administration | 452 | 1.25% |
| Email and SMTP | 192 | 0.53% |
eCommerce – 19.04%
| Plugin | Views | Share of category |
| WooCommerce | 6,711 | 97.3% |
| Moloni | 101 | 1.5% |
| Easy Digital Downloads | 82 | 1.2% |
WooCommerce takes the category almost entirely. Store owners live in the orders screen.
Security and tools – 14.86%
| Plugin | Views | Share of category |
| Jetpack | 5,130 | 95.4% |
| Wordfence | 233 | 4.3% |
| Sucuri | 9 | 0.2% |
| Solid Security | 8 | 0.1% |
Jetpack’s number is driven by one screen: the stats dashboard, which people open to look at traffic rather than at security.
SEO – 4.15%
| Plugin | Views | Share of category |
| desjop-ai-seo | 1,061 | 70.6% |
| Rank Math | 211 | 14.0% |
| Site Kit by Google | 89 | 5.9% |
| Yoast SEO | 76 | 5.1% |
| All in One SEO | 33 | 2.2% |
Among the plugins we could verify, Rank Math is opened roughly three times more often than Yoast in this sample – a reversal of the install-count picture, where Yoast leads.
Contact forms – 3.54%
| Plugin | Views | Share of category |
| Formidable Forms | 567 | 44.2% |
| WPForms | 296 | 23.1% |
| Contact Form 7 | 216 | 16.8% |
| Gravity Forms | 158 | 12.3% |
| Fluent Forms | 45 | 3.5% |
Contact Form 7 dominates installs and comes third in attention. Formidable Forms leads the category with a fraction of the installs – its users build and edit forms rather than place one and forget it.
Performance and cache – 2.23%
| Plugin | Views | Share of category |
| WP Super Cache | 263 | 32.5% |
| WP Rocket | 217 | 26.9% |
| LiteSpeed Cache | 158 | 19.6% |
| Redis Object Cache | 112 | 13.9% |
| WP-Optimize | 55 | 6.8% |
The whole category is 2.23% of admin attention. Caching is the clearest example of infrastructure: configured once, then invisible.
Import, backup and migration – 33.05%
| Plugin | Views | Share of category |
| WP All Import | 11,795 | 98.6% |
| Duplicator | 63 | 0.5% |
| UpdraftPlus | 63 | 0.5% |
| WPvivid | 32 | 0.3% |
| All-in-One WP Migration | 13 | 0.1% |
The largest category by attention, and almost entirely one plugin. Data migration is slow, manual work that keeps an administrator in front of the screen; backups run on schedule and are opened only when something breaks.
Email and SMTP – 0.53%
| Plugin | Views | Share of category |
| WP Mail SMTP | 118 | 61.5% |
| FluentCRM | 43 | 22.4% |
| MailPoet | 26 | 13.5% |
| Mailchimp for WordPress | 5 | 2.6% |
Page builders – 1.37%
| Plugin | Views | Share of category |
| Elementor | 284 | 57.4% |
| Divi | 134 | 27.1% |
| Bricks | 77 | 15.6% |
The number understates these tools rather than describing them: builders are used inside the page editor, which is a different set of URLs. Treat this table as a comparison between builders, not as a measure of how much they are used.
Anti-Spam
We are not publishing a ranking for this category. Every site in the sample runs a CleanTalk plugin, so any anti-spam chart built on this data would say more about our own user base than about the market. Akismet appears once in the entire week.
Three things that surprised us
- Attention and installs are almost unrelated. A plugin can be everywhere and be opened by nobody.
- The busiest category is data migration, not commerce. Imports take a third of all admin attention in this window.
- Analytics is what people actually open. The most-viewed screen inside Jetpack is the stats page. Administrators come to the admin panel to look at numbers, not to configure security.
How to cite this data
You are welcome to quote and link. Please describe the metric correctly: it is admin page views over a seven-day window, on sites running a CleanTalk security plugin, with our own plugins excluded. It is not install counts, not unique users and not market share. If you need a specific cut of the data for research, write to us.
Next report
The next issue counts unique sites per plugin over a full calendar month and shows both numbers together – sites and views. Same categories, same method, a more stable picture.
Resources
- Security & Malware scan by CleanTalk – the data source
- Anti-Spam by CleanTalk
- CleanTalk

Leave a Reply